Downtown Ottawa Then vs Now: How Home Prices Have Changed Since 1956
In this reel, Kevin compares downtown Ottawa in the early 1900s with the city today, and points out that 1956 is the earliest year the Ottawa Real Estate Board (OREB) tracks for home prices. Here is that full price history in one place, with plain-language notes on how to read it.
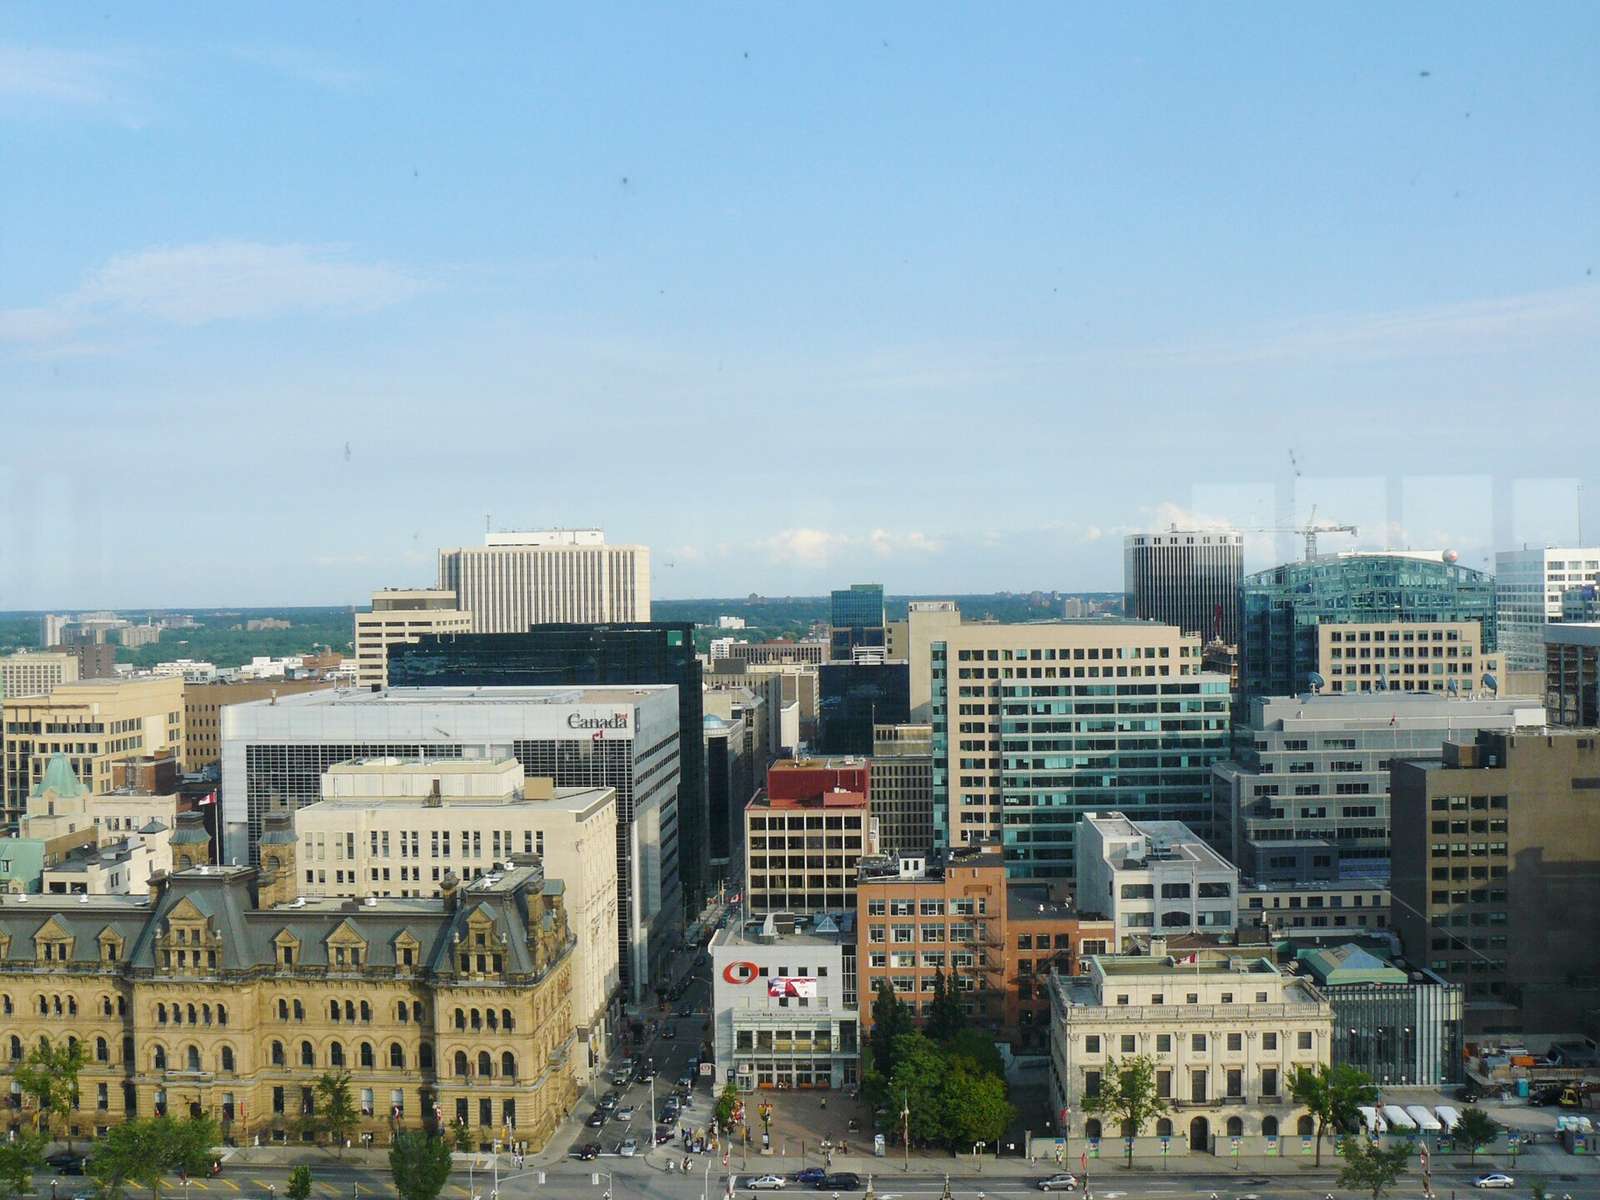
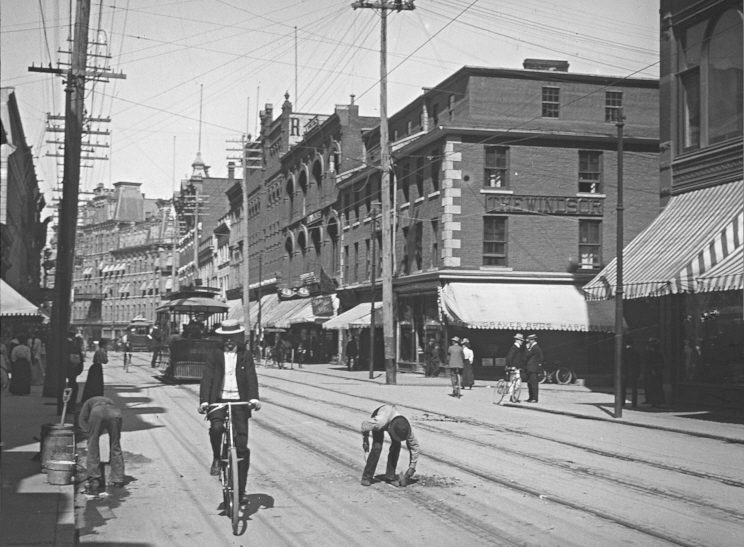
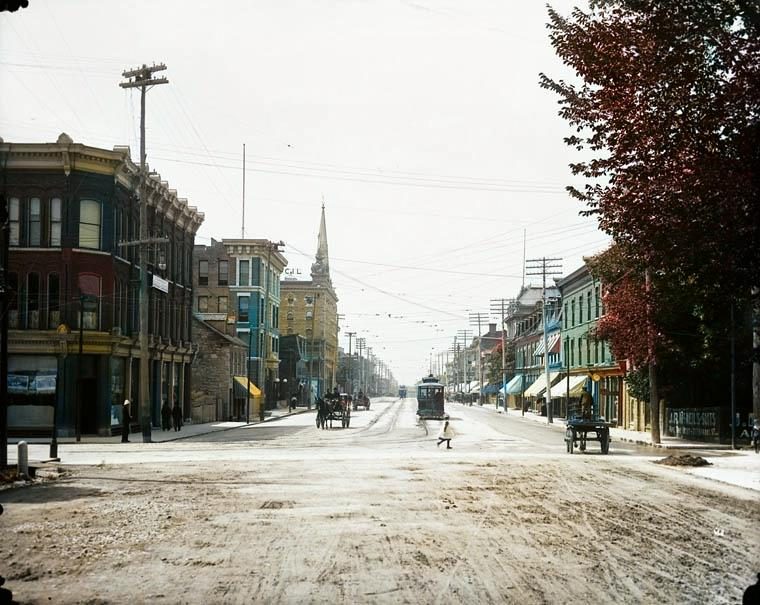
Downtown, then and now
In the early 1900s, downtown was a low-rise city of brick storefronts, streetcars and horse-drawn wagons. For a long time it stayed that way by design: until 1965, Ottawa limited buildings to 45.5 metres so the Peace Tower, finished in 1927, would dominate the skyline. Today the Ottawa-Gatineau region has 90 buildings taller than 75 metres, and since 2022 the tallest has been Claridge ICON in Little Italy.
Ottawa's average home price by decade
These are OREB's average prices for all MLS® residential sales, including condos, for the full year.
| Year | Average sale price |
|---|---|
| 1956 | $13,351 |
| 1966 | $18,004 |
| 1976 | $54,623 |
| 1986 | $111,643 |
| 1996 | $140,513 |
| 2006 | $255,889 |
| 2016 | $371,897 |
| 2021 | $645,976 |
By our math from OREB's figures, the average price grew about 48 times between 1956 and 2021, which works out to roughly 6.1% a year compounded. That figure is not adjusted for inflation.
The biggest jumps and the dips
Prices did not climb in a straight line. The biggest one-year increases in OREB's series were:
- 1973: up 25.3%, followed by another 21.8% in 1974
- 2021: up 22.0%, after 19.9% in 2020
- 1983: up 21.3%, followed by 18.4% in 1984
- 1968: up 19.8%
And prices have fallen. The average dropped 4.3% in 1961, and in the mid-1990s it fell three years in a row (1994, 1995 and 1996). The 1993 average of $148,129 was not topped again until 1999, so it took about six years for the average to climb back above its 1993 level.
Where prices are now
In September 2026, OREB reported:
- An average sale price of $685,640, down 1.0% from a year earlier
- A median sale price of $625,000, down 0.8%
- An MLS® Home Price Index benchmark of $623,500, down 0.3% from a year earlier and 2.2% from August
For context, OREB described 2025 as a year of balance and stability: full-year sales finished 1.3% higher than in 2024 and total dollar volume was up 4.1%, while the December 2025 average of $658,943 was essentially unchanged from December 2024. Even then, OREB called condos the softest part of the market, with 7.9 months of apartment inventory in December 2025, compared with 4.3 for single-family homes.
Downtown condo buyers have more room right now. The Ottawa Centre area had 6.8 months of inventory in September, and the citywide apartment benchmark was $380,800, down 6.1% from a year earlier. Compare central neighbourhoods in our Centretown guide.
How to read these numbers
- Average is the total dollars paid divided by the number of sales. A month with more detached houses sold pushes it up, even if values did not change.
- Median is the middle sale: half sold for more, half for less.
- Benchmark (HPI) tracks the estimated price of a typical home with the same features over time, which makes it a better guide to whether values are really moving.
- These are not inflation-adjusted. To compare 1956 dollars with today, try the Bank of Canada inflation calculator.
- This is the whole board area, not downtown alone, and OREB itself cautions that averages show trends but should not be used to value a specific property.
Want to know what your own home is worth today? Get a free home evaluation, or plan a purchase with the closing cost calculator.
Frequently asked questions
What was the average home price in Ottawa in 1956?
According to the Ottawa Real Estate Board, the average MLS® residential sale price, including condos, was $13,351 in 1956, the first year in its published series.
What is the average home price in Ottawa now?
OREB reported an average residential sale price of $685,640 in September 2026, down 1.0% from a year earlier. The median was $625,000 and the MLS® HPI benchmark was $623,500.
What was the biggest one-year jump in Ottawa home prices?
In OREB's series, the biggest annual increase was 25.3% in 1973. The next largest were 22.0% in 2021 and 21.8% in 1974.
Have Ottawa home prices ever gone down?
Yes. The yearly average fell in 1961 and 1962, and again in 1994, 1995 and 1996. The 1993 average of $148,129 was not passed again until 1999.
Is the average price the same as what my home is worth?
No. The average reflects whatever mix of homes sold. OREB cautions it should not be used to value a specific property. A home evaluation based on recent nearby sales is the better guide.
Talk to Kevin
Questions about buying or selling in Ottawa? Call or text Kevin Lai at 613.291.0789 or email kevin.lai@exprealty.com. Kevin Lai, REALTOR®, eXp Realty Brokerage. Meetings by appointment. You can also send a message or get a free home evaluation.
Sources
- Ottawa Real Estate Board: MLS® residential sales average price, 1956 to 2021 (PDF)
- Ottawa Real Estate Board: September 2026 market report
- Ottawa Real Estate Board: Ottawa housing market closes 2025 on a note of stability
- Wikipedia: List of tallest buildings in Ottawa-Gatineau
- Bank of Canada: Inflation calculator
